Connecticut town file · all towns
New London
Every local number the desk holds for this town, each naming its own source. Know where you live.
Property tax base
Net grand list from the CT Open Data Portal, via this story.
| Net grand list, 2025 | $2,209,800,267 |
| Net grand list, prior vintage | $2,193,819,750 |
| Change between the latest two assessment rolls | $15,980,517 (+0.7%) |
| Rank among 169 Connecticut places | 126 of 169 |
| Statewide median change (for context) | +1.2% |
Property tax rate
Municipal mill rate for real property, fiscal year 2027, from the CT Open Data Portal via this story. Service-district rates are separate and not shown here.
| Mill rate, FY2027 | 27.10 mills per $1,000 |
| Rank among 169 Connecticut places | 90 of 169 |
| Compared with the statewide rate | 1.02× the statewide average |
| Statewide rate, weighted by taxable value | 26.65 mills |
| Estimated tax on a median-value home (assessment 70% of market per state law) | $4,805 a year |
Where New London sits
| Measure | New London | Connecticut | Difference | Rank among towns |
|---|---|---|---|---|
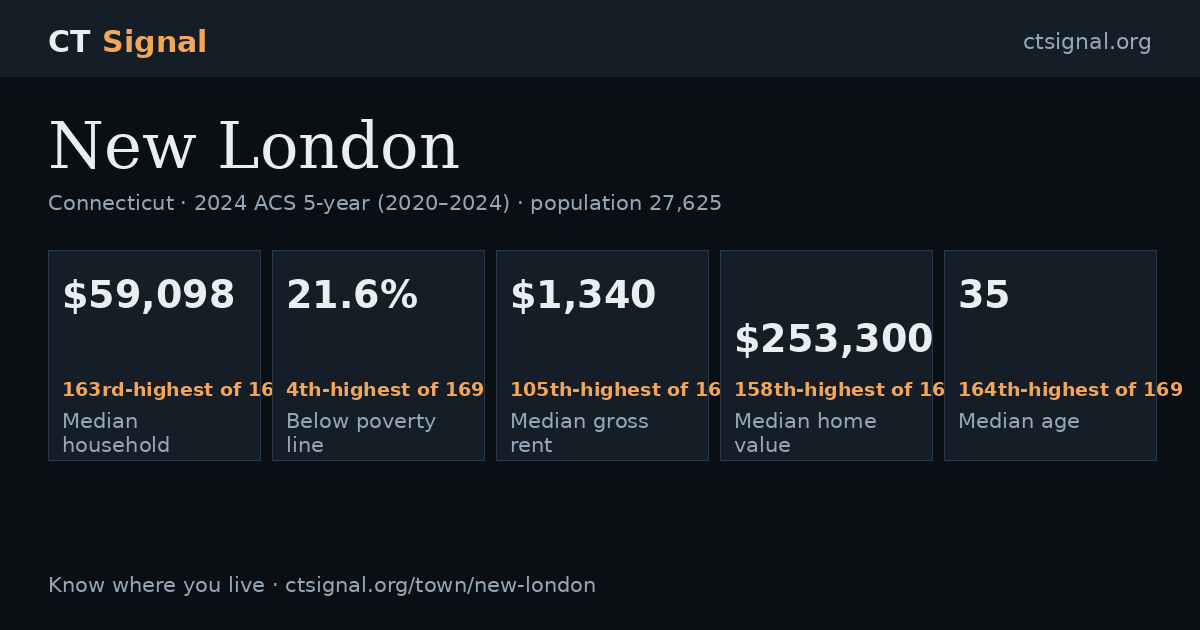
| Median age | 34.7 | 41.1 | 16% below CT | 164th of 169 |
| Median household income the state answer → | $59,098 | $95,781 | 38% below CT | 163rd of 169 |
| Below poverty line the state answer → | 21.6% | 10.0% | 11.6 points above CT | 4th of 169 |
| Median gross rent the state answer → | $1,340 | $1,488 | 10% below CT | 105th of 169 |
| Median home value the state answer → | $253,300 | $366,900 | 31% below CT | 158th of 169 |
US Census Bureau, 2024 ACS 5-year (2020–2024), county-subdivision level — the estimates built for places this size. Ranks run across the 169 places with published values. Suppressed cells are dashes, not zeros. Poverty is the same table the state story uses, so the two pages cannot tell different stories.